

The SMT Indicator tracks the current level of upward stock market momentum
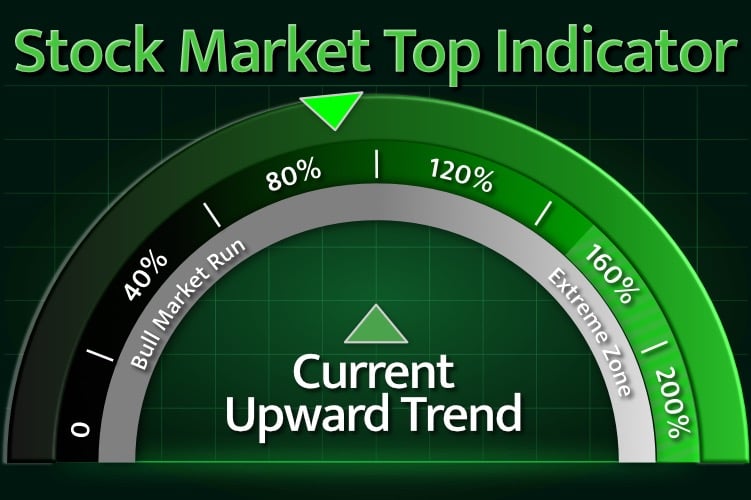

The Stock Market Top Indicator (SMT Indicator) provides valuable insights into the current upward trend of the entire U.S. stock market. It tracks the percentage increase of the entire stock market since the last significant market decline. When the SMT Indicator reaches the Extreme Zone, it serves as a warning that the market is overdue for a major correction.
The MTI chart warns in advance of a market topping pattern
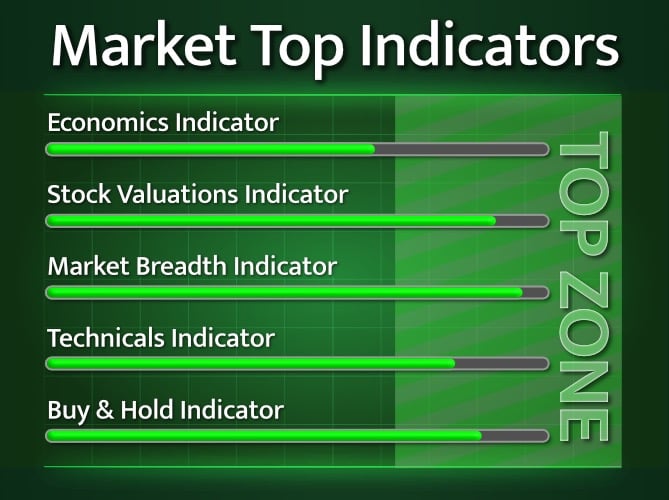

The Market Top Zone Indicators closely monitor the overall stock market to identify a potential topping-off pattern. When all five indicators simultaneously reach the Top Zone, it signals that the market is overheating and is due for a pullback from recent highs.
SMT Quarterly market forecast chart with upper resistance level


The Market Top Resistance Level chart tracks the quarterly value of the entire stock market and projects the most likely trading range for the next quarter. The dotted line indicates resistance at the next highest level of the trading range. When the highlighted projection indicator reaches the dotted line, this signals the market has reached a key resistance level and is due for a breather.
Stock Market Top Indicator is Available on your favorite app store
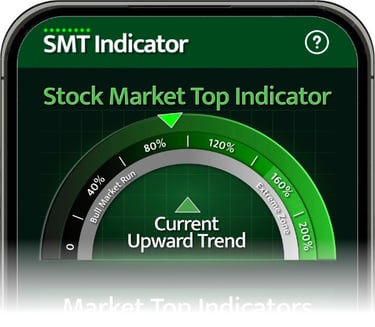
Download the SMT Indicator from your favorite app Store today.